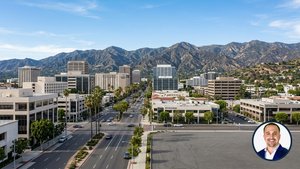




San Gabriel CA Real Estate Market Report 2026
Current prices, neighborhood breakdowns, school data, and buyer/seller strategies for San Gabriel CA - updated for 2026.
San Gabriel CA Real Estate Market Overview 2026
San Gabriel sits at the geographic and cultural center of the San Gabriel Valley. Flanked by Alhambra to the west, Arcadia to the north, Temple City to the east, and Rosemead to the south, the city draws buyers who want SGV community character without Arcadia's premium price tag or Alhambra's density. In 2026, that position makes San Gabriel one of the most stable and competitive mid-market cities in the eastern Los Angeles corridor.
The median single-family home price has settled in the $850,000-$920,000 range - a figure that reflects continued demand pressure from Chinese-American families, SGV professionals priced out of Arcadia, and first-time buyers who can still find entry-level condos and smaller SFRs below $750,000. Price per square foot averages $580-$660 depending on zone and condition, with Mission District estate homes reaching $700-$750 per square foot.
The market remains firmly in seller's territory in 2026. Inventory sits at 4-6 weeks of supply - well below the 6-month balanced-market threshold. The list-to-sale ratio of 102-105% means buyers routinely write above asking on well-presented homes. Days on market has compressed to 22-30 days citywide, with Mission District and Central San Gabriel properties often receiving multiple offers within the first 14 days of listing.
San Gabriel's competitive edge comes from three structural drivers: (1) the city is walkable to Valley Blvd and Las Tunas dining retail corridors that draw Chinese-American buyers specifically; (2) it sits in the shadow of Arcadia's $1.1M+ median, making it a natural spillover market; (3) the historic San Gabriel Mission (est. 1771) - one of California's original 21 missions - anchors neighborhood identity and tourism that sustains desirability for decades.
San Gabriel's Chinese-American buyer concentration creates a predictable annual pattern: buyer activity slows during the Lunar New Year period (typically late January through mid-February). Sellers who list during this window often see fewer initial showings. The strongest demand window opens in late February and runs through June. Timing your listing around this rhythm can mean the difference between a 7-day multiple-offer scenario and a 45-day wait.
🏠 FREE Weekly Workshop — First-Time Buyer Blueprint
Learn exactly how to buy a home in LA — prices, process, and pitfalls. Live every week, totally free.
Reserve Your Free Seat →San Gabriel Neighborhood Breakdown: 3 Pricing Zones
San Gabriel is not a one-price city. The distance between the Mission District in the north and the Rosemead border in the south can represent a $150,000-$200,000 difference in home values. Understanding which zone you are targeting - and why prices vary - is the foundation of any sound buy or sell decision in this market.
Below are the three core pricing zones, each with its own buyer profile, demand drivers, and typical home characteristics. These zone boundaries are approximate - individual streets and school assignment maps can shift values within a few blocks.
Proximity to the San Gabriel Mission Playhouse - a National Historic Landmark and active cultural venue that hosts 200+ events annually - creates a genuine quality-of-life premium in the Mission District. Buyers in this zone are not just paying for square footage. They are paying for neighborhood identity and the institutional anchors that protect long-term value.
San Gabriel vs Neighboring SGV Cities: Price Comparison 2026
One of the most common questions buyers ask me is how San Gabriel compares to Alhambra, Arcadia, Temple City, and Rosemead. The honest answer: San Gabriel sits in a strategic middle position - more affordable than Arcadia, more desirable than Rosemead, and directly comparable to Temple City depending on which street you are on.
The comparison table below gives you a current side-by-side view. Use it to calibrate whether San Gabriel is truly the right fit for your budget and priorities, or whether an adjacent city offers better value for your specific situation.
| City | Median SFR Price | Avg $/Sq Ft | Avg DOM | L/S Ratio | Price Relative Bar |
|---|---|---|---|---|---|
| Arcadia | $1,150,000 - $1,300,000 | $680 - $780 | 25-35 days | 103-107% | |
| San Gabriel | $850,000 - $920,000 | $580 - $660 | 22-30 days | 102-105% | |
| Temple City | $980,000 - $1,150,000 | $610 - $700 | 18-26 days | 103-108% | |
| Alhambra | $800,000 - $870,000 | $540 - $620 | 24-32 days | 101-104% | |
| Rosemead | $740,000 - $800,000 | $500 - $580 | 22-30 days | 101-104% |
When buyers are priced out of Arcadia (median $1.15M+), they frequently land in San Gabriel. This creates a structural demand floor: San Gabriel gets a steady stream of motivated, qualified buyers who have already done their budget math and chosen San Gabriel as their best available option. For sellers, this is meaningful - your buyer pool includes people who wanted Arcadia but cannot afford it, which creates urgency and reduces negotiation friction.
San Gabriel Schools: SGUSD Data for 2026
San Gabriel Unified School District (SGUSD) serves the city and is a significant driver of buyer interest, particularly among Chinese-American families. School quality varies by level and campus - the data below reflects current ratings and should be verified directly with SGUSD before any purchase decision, as school boundaries and enrollment policies can shift between school years.
One honest note I give buyers: San Gabriel is not Temple City or Arcadia on school ratings. The SGUSD schools are solid and improving, but buyers prioritizing a 10/10 rated high school as their top criterion should cross-reference Temple City Unified (Temple City High, rated 8-9/10) and Arcadia Unified (Arcadia High, rated 9/10). What San Gabriel does offer is community character, pricing below those cities, and an active parent community that has driven visible improvement in SGUSD outcomes over the past decade.
School boundary maps in the SGV shift periodically, and some San Gabriel addresses feed into different school zones than a buyer assumes based on ZIP code. Before any purchase, call SGUSD directly at their enrollment office and confirm the specific schools assigned to the target property address. Relying on online mapping tools without district confirmation has caused surprises for buyers in this market.
Who Is Buying in San Gabriel in 2026
Understanding the competing buyer pool is as important as understanding the price. In San Gabriel, the buyer pool is concentrated and motivated. In my 13 years working the SGV, I have seen this market attract a consistent cast of buyers - and knowing who they are helps both buyers calibrate their offers and sellers understand what they are marketing to.
Seller Strategy for San Gabriel in 2026
A 103% list-to-sale ratio sounds like sellers can list anything at any price and succeed. That is not how it works. The 103% average is pulled by well-prepared homes in strong zones. Overpriced or under-prepared homes in San Gabriel can sit for 45+ days and end up with price reductions that signal weakness to buyers. The difference between a 7-day multiple-offer close and a 60-day slog often comes down to three decisions: price, timing, and preparation.
Estimated Net Proceeds: San Gabriel SFR 2026
The calculations below are illustrative estimates using a standard 5.5% commission structure (post-NAR settlement), 1% in seller closing costs, and assuming a sale at 103% of list price in a normal escrow timeline. Your actual net will vary based on mortgage payoff, HOA fees, and negotiated terms.
If you have owned your San Gabriel home for 10+ years, Prop 19 may allow you to transfer your low property tax base to a replacement home anywhere in California. This is a significant financial benefit worth understanding before you list. Call me to walk through how it applies to your specific situation before you make a move decision.
ADU and Investment Analysis: San Gabriel 2026
San Gabriel's mix of older SFR lots in South San Gabriel, arterial multi-family zoning on Valley Blvd and Rosemead Blvd, and strong rental demand from SGV workers makes the city a credible ADU investment market. The investor buyer pool has grown noticeably since 2022, particularly in South San Gabriel where lot sizes often support detached ADU construction at reasonable cost.
The math on ADUs in San Gabriel works better than in many SGV cities because the cost basis is lower (South SG entry prices are $760K-$820K vs Arcadia's $1.1M+), rental rates are strong (SGV demand keeps vacancies low), and the permit process through the City of San Gabriel has become more predictable since state ADU preemption laws went into effect.
| ADU Type | Typical Size | Est. Build Cost | Est. Monthly Rent | Best Zones |
|---|---|---|---|---|
| Detached ADU | 600-1,000 sf | $160K - $240K | $2,200 - $2,800 | South SG, larger lots |
| Attached ADU (Garage Convert) | 400-700 sf | $80K - $130K | $1,600 - $2,100 | Central SG, Mission District |
| JADU (Junior ADU) | Up to 500 sf | $40K - $80K | $1,200 - $1,600 | All zones (interior conversion) |
| Multi-Family Acquisition | Duplex / Triplex | N/A (purchase) | $1,800 - $2,400/unit | Valley Blvd, Rosemead Blvd corridors |
San Gabriel is an independent city within Los Angeles County - not part of the City of Los Angeles. This means Measure ULA (the city's "mansion tax" of 4-5.5% on sales above $5M) does not apply. It also means San Gabriel follows county rent control rules (AB 1482 statewide protection), not LA City's stricter RSO system. For investors, this distinction matters for both acquisition and ongoing management strategy.
San Gabriel CA: Honest Pros and Cons for 2026
Every market has strengths and trade-offs. The buyers and sellers I work with in San Gabriel appreciate honest context more than cheerleading. Here is a balanced read on what San Gabriel delivers and where it asks you to accept limitations.
- Historic San Gabriel Mission (est. 1771) anchors neighborhood identity and tourism
- Below Arcadia pricing with similar SGV community character
- Strong Chinese-American cultural infrastructure: dining, retail, community on Valley Blvd
- No Measure ULA - outside LA City limits saves investors on exit taxes
- Valley Blvd and Las Tunas Drive walkability - genuine daily-errand walkability without a car
- ADU upside in South SG - smaller entry price + ADU = strong blended returns
- San Gabriel Mission Playhouse - active cultural venue drives year-round foot traffic and identity
- Arcadia spillover demand creates a structural floor under San Gabriel prices
- SGUSD schools are solid but not Arcadia or Temple City level - high school ratings lag behind neighboring districts
- Lunar New Year buyer pause requires timing awareness - listing in January can result in slower first week
- Traffic on Valley Blvd and Rosemead Blvd corridors can be significant during peak hours
- Older housing stock (many homes 1950s-1970s) means inspection issues are common - galvanized pipes, aging electrical, older roofs
- Limited new construction options - San Gabriel has very few new builds; buyers who want a new home need to look at ADU conversions or teardown lots
- Condo supply is thin - buyers seeking a condo under $600K have few active choices at any given time
- Not in VHFHSZ (good for fire insurance costs), but proximity to foothills means some buyers still ask about wildfire risk
San Gabriel Real Estate Cheat Sheet 2026
This table gives you the core reference data you need at a glance - whether you are writing an offer, preparing to list, or evaluating San Gabriel against a competing city.
| If You Want to Know... | The Answer Is... |
|---|---|
| Median SFR price (city) | $850,000 - $920,000 |
| Mission District price range | $930,000 - $1,050,000 |
| Central SG price range | $820,000 - $920,000 |
| South SG price range | $760,000 - $820,000 |
| Price per square foot | $580 - $660 (varies by zone) |
| Average days on market | 22 - 30 days citywide |
| List-to-sale ratio | 102% - 105% |
| Inventory level | 4 - 6 weeks of supply (seller's market) |
| Best time to list | Late February through June |
| Lunar New Year buyer pause | Late January through mid-February |
| Dominant buyer type | Chinese-American SGV families |
| High school rating | San Gabriel High - 6/10 |
| Measure ULA applicable? | No - San Gabriel is outside LA City limits |
| ADU potential zone | South SG and Valley Blvd corridor |
| Fire risk (VHFHSZ) | Not classified as VHFHSZ - standard fire insurance rates |
| Transfer tax rate | County: $1.10 per $1,000 (no city tax) |
San Gabriel Real Estate Timing Calendar: When to Buy and Sell in 2026
Timing in the San Gabriel market is not just about mortgage rates or the broader economy. It is about aligning with the rhythms of the local buyer pool - specifically the Chinese-American family buyer who drives the Mission District and Central SG market, and the investor buyer who targets South SG year-round. Understanding the calendar gives both buyers and sellers a meaningful tactical edge.
| Month / Period | Market Conditions | Best For | Key Driver |
|---|---|---|---|
| January (early) | Slow start, inventory building | Buyers - less competition | Post-holiday market reset |
| Late Jan - Mid Feb | Lunar New Year buyer pause | Sellers - avoid listing now | Chinese-American cultural calendar |
| Late Feb - March | Strong demand surge, multiple offers | Sellers - peak listing window opens | Post-holiday pent-up demand + school enrollment |
| April - May | Peak competition, fast days on market | Both - high activity, strong pricing | Spring buying season + SGUSD enrollment deadlines |
| June - July | Activity sustains into summer | Sellers - families want keys before school | School-year preparation urgency |
| August | Brief slowdown as school starts | Buyers - slightly less competition | Families settled, less urgency |
| September - November | Secondary selling season resumes | Sellers - strong secondary window | Fall buyer return, year-end motivation |
| December | Market quiets, fewer active buyers | Buyers - motivated sellers, less competition | Year-end tax and relocation motivation |
Most sellers in San Gabriel have no idea that listing in late February captures pent-up Chinese-American buyer demand that built up during a three-week pause. Buyers who were actively looking in early January did not go away - they just paused. When they come back, they are motivated and often competing against each other on the same well-priced listings. Sellers who list in the last week of February or first week of March consistently outperform those who list in January or wait until April.
Common Inspection Issues in San Gabriel Homes: What Buyers Should Know
San Gabriel's housing stock is dominated by homes built between the 1940s and 1970s. That era of construction comes with predictable inspection findings that buyers and sellers should understand before entering escrow. I have watched deals fall apart and renegotiate because neither party understood what was typical for this market. The table below covers the most common issues I see in San Gabriel inspections.
Understanding these issues in advance does two things: it helps buyers calibrate their credit requests accurately (instead of walking away from a deal that just needs a standard repair), and it helps sellers proactively address the items most likely to trigger a credit demand or escrow renegotiation.
| Inspection Issue | Frequency | Typical Cost Range | Seller Strategy |
|---|---|---|---|
| Galvanized supply piping | Very Common (pre-1970 homes) | $8,000 - $18,000 to repipe | Credit buyer or repipe before listing |
| Aging electrical panel (60A or fuse box) | Common | $3,500 - $7,000 to upgrade to 200A | Upgrade before listing - ROI is strong |
| Roof at end of service life | Common | $12,000 - $22,000 to reroof | Get inspection report before listing - credit or replace |
| Foundation cracks (hairline to moderate) | Moderate | $2,000 - $15,000 depending on severity | Get structural engineer report upfront - document it |
| Drainage and grading issues | Common | $1,500 - $6,000 | Often addressable before listing at lower cost |
| Original single-pane windows | Very Common | $8,000 - $20,000 to replace whole-house | Credit buyer or replace high-visibility windows only |
| Unpermitted additions or conversions | Moderate (garage conversions especially) | $5,000 - $30,000+ to permit or remove | Disclose upfront and price accordingly |
A $400 pre-listing inspection report is the best $400 a San Gabriel seller can spend. When you know the inspection findings before the buyer does, you control the narrative. You can fix the items that deliver the best return, credit the items that are not worth repairing, and disclose everything with documentation - which dramatically reduces the chance of a surprise credit request in escrow that blows up your timeline. Buyers in this market are sophisticated. Coming to the table with a clean inspection report signals a prepared seller and reduces negotiating friction.
Buyer Strategy: How to Win in the San Gabriel Market in 2026
Buying in a 102-105% list-to-sale market requires a different mental model than buying in a balanced or buyer's market. The buyers who win consistently in San Gabriel are not necessarily paying the most - they are presenting the most clearly and moving the fastest. In my experience working San Gabriel transactions, the difference between winning and losing an offer competition usually comes down to three things: financing clarity, timeline flexibility, and offer structure.
The Chinese-American family buyer pool in San Gabriel is experienced and well-capitalized. Many have bought before, have established bank relationships, and can move quickly. To compete effectively, buyers from outside this pool need to match their level of preparation - which means having your financing locked before you fall in love with a house, not after.
The 2026 FHA loan limit for Los Angeles County is approximately $1,149,825 for a single-family home. That ceiling covers most of the San Gabriel market below the Mission District premium. However, FHA offers are generally less competitive in San Gabriel because the 3.5% down payment requirement and required FHA appraisal conditions give sellers concerns about deal certainty. If you are an FHA buyer, your strongest play is offering a shorter inspection period, demonstrating a strong pre-approval, and targeting homes that have been on market 14+ days where the seller's position has softened.
5 Mistakes San Gabriel Sellers Make in 2026
After 13 years closing transactions in San Gabriel and the broader SGV, I have seen the same avoidable mistakes cost sellers $30,000-$80,000 or add months to their timelines. These are not rare edge cases - they are patterns I see in multiple transactions every year. Knowing them in advance is the difference between a clean, fast close and a frustrating renegotiation.
San Gabriel Real Estate Market Outlook: Rest of 2026
Predicting real estate markets is an exercise in humility - any honest practitioner will tell you that. What I can offer is a grounded read on the structural forces that will shape San Gabriel's market through the rest of 2026, based on what I am seeing in active transactions, buyer conversations, and the broader SGV trend lines.
The structural case for San Gabriel remaining a seller's market through 2026 is solid. Inventory is constrained by the same forces limiting supply across the SGV: long-tenured owners with low property tax bases who have no financial incentive to sell, a near-zero new construction pipeline within city limits, and continued in-migration of Chinese-American families from other SGV cities as second-generation buyers form their own households. None of those factors reverse quickly.
The primary risk to San Gabriel's 2026 seller's market is a sustained increase in mortgage rates above 7.5%. At that level, the FHA and conventional buyer pool in the $800K-$920K range compresses meaningfully, as monthly payments approach affordability ceilings for the SGV professional buyer. The cash and high-down-payment buyer pools (especially the Chinese-American family buyer) are more insulated from rate moves, which would keep Mission District pricing relatively protected even in a rate spike scenario.
What Makes San Gabriel Different: Cultural Identity and Community Anchors
Real estate data tells you what a market costs. It does not tell you why people choose it over a cheaper or pricier alternative. San Gabriel has a specific community identity that is worth understanding - because it directly explains both who buys here and why prices in certain zones hold a premium that pure $/sqft analysis cannot capture.
The San Gabriel Mission, established in 1771 as the fourth of California's 21 missions, is not just a historical artifact. It is an active parish, a cultural destination drawing 100,000+ annual visitors, and the literal origin point of the entire San Gabriel Valley. Homes within walking distance of the Mission carry a place identity premium that is real and documented across decades of comparable sales data.
The San Gabriel Mission Playhouse - a 1,355-seat performing arts venue listed on the National Register of Historic Places - anchors the Mission District's cultural scene with live theater, concerts, and community events year-round. Buyers who have attended events at the Playhouse before purchasing often cite it as a deciding factor in choosing San Gabriel over comparable-priced options in Alhambra or Monterey Park.
San Gabriel Square on Valley Boulevard is one of the most concentrated Chinese dining and retail destinations in the western United States. For Chinese-American buyers, proximity to the Square is not a lifestyle preference - it is a practical necessity that shapes daily life for multigenerational households. This explains why Central San Gabriel properties closest to the Valley Blvd corridor consistently outperform nearby Rosemead properties on price per square foot, despite similar physical characteristics.
Some buyers ask me whether Mission District pricing is sustainable or whether it reflects irrational enthusiasm for history. The honest answer: the premium is structural. The Mission, the Playhouse, and the established tree canopy of the area are not going anywhere. They create a neighborhood identity that attracts buyers who specifically want this type of environment - and that demand pool is not shrinking. Mission District prices have outperformed the broader San Gabriel average in 8 of the last 10 years on appreciation, according to CRMLS data. That is a structural pattern, not sentiment.
San Gabriel Closing Costs and Escrow Timeline: What to Budget
One of the areas where buyers and sellers in San Gabriel are most frequently surprised is the closing cost calculation. People focus on purchase price and commission, but the full picture includes transfer taxes, title insurance, escrow fees, and lender costs that add up quickly. Below is a practical breakdown for a $900,000 San Gabriel transaction.
| Closing Cost Item | Who Pays | Estimate (at $900K) | Notes |
|---|---|---|---|
| County Transfer Tax | Seller (typically) | $990 | $1.10 per $1,000 - county only, no city tax in San Gabriel |
| Title Insurance (Owner's Policy) | Seller (typically) | $2,200 - $2,800 | Protects buyer from title defects; rate varies by insurer |
| Escrow Fee | Split buyer / seller | $4,000 - $5,500 total | Based on sale price; escrow companies vary on rate |
| Real Estate Commission | Seller | $44,000 - $49,500 | 4.5% - 5.5% of sale price; negotiated per NAR settlement framework |
| Lender Origination Fees | Buyer | $2,500 - $5,000 | Varies by lender and loan type; can be negotiated |
| Appraisal Fee | Buyer | $600 - $900 | Required for conventional and FHA loans |
| Home Inspection | Buyer | $450 - $650 | General inspection; add $200-$400 for sewer scope and roof inspection |
| Natural Hazard Disclosure Report | Seller | $100 - $150 | Standard California requirement |
| Property Taxes (Prorated) | Split at close | Varies | Prorated to close date; buyer assumes from close forward |
Standard San Gabriel Escrow Timeline
A typical San Gabriel residential transaction runs 30-45 days from accepted offer to close. Here is the standard sequence buyers and sellers should plan around:
San Gabriel is an independent city that does not impose a city-level transfer tax on top of the county rate. Sellers pay only the Los Angeles County transfer tax of $1.10 per $1,000 of sale price. At a $900,000 sale price, that is $990 total. Compare this to the City of Los Angeles, where sellers face an additional $4.50 per $1,000 city tax on top of the county rate - meaning an LA City seller pays $5,940 in total transfer taxes on the same $900,000 sale versus $990 in San Gabriel. This is one of the underappreciated advantages of selling in a city that is inside Los Angeles County but outside the City of Los Angeles.
💰 What's My Home Worth in 2026?
Get a free, accurate valuation from Justin Borges — backed by real comps, not a Zestimate.
Get My Free Home Valuation →San Gabriel Real Estate FAQs 2026
What is the median home price in San Gabriel CA in 2026?
The median single-family home price in San Gabriel sits in the $850,000-$920,000 range in 2026. Mission District properties command a premium of 10-15% over city average, while South San Gabriel homes near the Rosemead border start in the $760,000-$820,000 range. Price per square foot runs $580-$660 across the city.
How fast are homes selling in San Gabriel in 2026?
Well-priced homes in San Gabriel are selling in 22-30 days on average. Mission District and Central San Gabriel properties near Las Tunas Drive move fastest, often receiving multiple offers within 7-14 days. Homes that need work or are priced above market can sit 45-60+ days.
Is San Gabriel a buyer's market or seller's market in 2026?
San Gabriel is a seller's market in 2026. The list-to-sale ratio of 102-105% and tight inventory of 4-6 weeks of supply put sellers in a strong position. Demand is driven by SGV diaspora buyers, Alhambra and Arcadia price spillover, and continued appetite from Chinese-American families targeting SGUSD schools.
What are the best neighborhoods in San Gabriel to buy in 2026?
Mission District north of the San Gabriel Mission offers the highest prestige and strongest appreciation history. Central San Gabriel along Las Tunas Drive offers walkable retail and mid-market entry points. South San Gabriel near the Rosemead border offers more affordable pricing with strong investor upside from ADU potential.
How are San Gabriel schools rated in 2026?
San Gabriel Unified School District (SGUSD) includes well-regarded elementary and middle schools, with San Gabriel High School serving the district. Schools vary by neighborhood - homes in the Mission District zone tend to attract the most school-driven buyer interest. Always verify current boundary maps with SGUSD before purchasing.
Is San Gabriel a good place to invest in real estate in 2026?
San Gabriel offers solid investment fundamentals in 2026. Strong ADU potential along arterial streets, demand from SGV diaspora buyers, and proximity to Alhambra and Temple City create durable appreciation pressure. South San Gabriel multi-family corridors on Valley Blvd and Rosemead Blvd offer the strongest rental yield potential.
What is the best time of year to sell a home in San Gabriel?
February through June is the strongest selling window in San Gabriel. Lunar New Year (late January to mid-February) causes a brief buyer pause as Chinese-American families observe the holiday. Listing in late February or March captures post-holiday pent-up demand and coincides with school enrollment season, which drives family buyer urgency.
How does San Gabriel compare to Alhambra and Arcadia for home prices?
San Gabriel sits between Alhambra and Arcadia on price. Alhambra medians run $800K-$870K (slightly below San Gabriel), while Arcadia medians push $1.1M-$1.3M (well above). San Gabriel offers Arcadia-adjacent prestige at a meaningful discount, which is a key reason SGV buyers spill into San Gabriel when priced out of Arcadia.
Related San Gabriel Valley Resources
Get Specific Advice for Your San Gabriel Move
Whether you are buying, selling, or just tracking the market, a 15-minute conversation with a San Gabriel specialist is the fastest way to get a clear picture of your options.
- Current CMA for your specific San Gabriel address
- Zone-by-zone buyer competition analysis
- Timing strategy based on your target window
- ADU feasibility check for investor buyers
Text us at (213) 262-5092 for a faster response. DRE #01940318. 680 E Colorado Blvd, Suite 180, Pasadena, CA 91101.