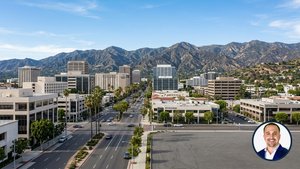




San Marino CA Real Estate Market Report 2026
Current price trends, inventory data, buyer demand analysis, and seller strategy for one of California's most exclusive residential communities.
- Market Trends & YoY Price Movement
- Price Tier Analysis: Sub-$2.5M / $2.5M–$4M / $4M+
- Buyer Demand: International Buyers & All-Cash Rate
- SMUSD School District Premium
- Seasonal Listing Performance
- Seller vs. Buyer Market Assessment
- San Marino vs. Pasadena, Arcadia & San Gabriel
- Investment Outlook & Appreciation History
- Seller Strategy Cheat Sheet
- FAQ: 8 San Marino Market Questions
🏠 FREE Weekly Workshop — First-Time Buyer Blueprint
Learn exactly how to buy a home in LA — prices, process, and pitfalls. Live every week, totally free.
Reserve Your Free Seat →San Marino Price Movement and Inventory Levels in 2026
San Marino has posted consistent appreciation through the first half of 2026, with median prices up roughly 5 to 7 percent year over year against the same period in 2025. This mirrors the broader SGV luxury trend but with one key difference: San Marino's supply constraint is structural, not cyclical. The city has fewer than 4,700 parcels total, no apartment zoning, and minimal new construction. When demand rises, there is simply no new product to absorb the pressure.
Active inventory at any given moment sits between 20 and 35 homes citywide. That figure sounds thin by typical market standards—it is exceptionally thin for a $3M+ price point, where buyers nationally expect weeks to browse before deciding. San Marino buyers often have shorter windows, particularly when SMUSD school enrollment deadlines drive a spring urgency that does not exist in most luxury markets.
The absorption rate—homes sold per month divided by active inventory—has been running in the 18 to 22 percent range in 2026. Anything above 15 percent is generally considered a seller's market. San Marino has been above that threshold for most of the past three years, interrupted only by brief cooling periods in late 2022 and early 2023 when interest rate shock temporarily softened demand at the financed end of the market.
Sub-$2.5M, $2.5M–$4M, and $4M+ Market Conditions
San Marino's market does not behave uniformly across price points. Conditions at $2 million differ sharply from conditions at $5 million, and sellers who fail to account for this tier-specific behavior often overprice or underprice by significant margins. Here is the breakdown as of mid-2026.
- Typical DOM 18–28 days
- List-to-sale ratio 105–108%
- Offer environment Multiple offers
- All-cash share ~35%
- Buyer profile SGV move-up
The most competitive segment. Well-priced listings regularly attract 3 to 6 offers. Buyers finance more frequently, so rate sensitivity exists, but SMUSD school demand keeps this tier active year-round.
- Typical DOM 28–42 days
- List-to-sale ratio 102–106%
- Offer environment 1–3 offers
- All-cash share ~50%
- Buyer profile International + tech
This is the most active segment by dollar volume. International buyers from Taiwan, mainland China, and Hong Kong dominate. Properties with newer kitchens and baths in this range move in under 30 days in spring.
- Typical DOM 45–90+ days
- List-to-sale ratio 97–101%
- Offer environment Single offers
- All-cash share ~65%
- Buyer profile Estate/ultraluxury
The estate tier rewards patience and private-network marketing. Few buyers exist at any moment. Pricing must be precise because a $5M listing that sits 120 days acquires stigma that is difficult to reverse.
International Buyers, All-Cash Rates, and Who Is Actually Buying in San Marino
San Marino has one of the highest concentrations of international luxury buyers in the entire Los Angeles metro area. Estimates from agents active in the market suggest approximately 40 to 50 percent of all completed transactions close all-cash, a rate far above the national luxury average of 20 to 25 percent. This is not accidental—it reflects the city's longstanding appeal to affluent Chinese and Taiwanese families who have deep roots in the SGV and place extreme weight on the SMUSD school system.
International buyer activity creates specific market dynamics that sellers need to understand. Overseas purchasers typically move in concentrated windows: Chinese New Year travel patterns create a late-January to mid-February pause, followed by a surge in February and March as buyers who have been doing research remotely arrive to transact. Summer is active for buyers from Taiwan who travel during school break. These cycles do not follow the traditional American spring-peak pattern cleanly—which means a San Marino seller who lists in late January may encounter more competition from other sellers than from qualified buyers.
Domestic buyers in San Marino tend to be high-income professionals in tech, finance, and medicine, along with SGV-area families upgrading from Arcadia, Alhambra, or Monterey Park. A secondary buyer pool includes families from outside California who are relocating specifically for SMUSD enrollment, particularly from the Bay Area and Pacific Northwest where tech company headquarters create transplant demand.
The largest single buyer segment. Primarily all-cash or large down payment. SMUSD and Huntington Library adjacency are primary drivers. Many purchase for family use during children's high school years.
Families in Arcadia, San Gabriel, and Alhambra who already live in the SGV and are upgrading into San Marino for school district access and larger estate lots. Finance more frequently than international buyers.
High earners from Pasadena, LA, or the Bay Area drawn by the combination of school quality, prestige, and manageable commute to downtown LA or Pasadena corporate campuses. Mix of financed and cash.
Ultra-high-net-worth buyers targeting the $4M+ estate segment for prestige, space, and long-term capital preservation. Often have no time pressure and negotiate carefully. Transactions in this tier can take 6 to 12 months from initial interest to close.
How the San Marino Unified School District Drives Home Values
In 13 years of working the SGV luxury market, I have seen very few pricing conversations in San Marino that do not eventually come back to SMUSD. The district serves roughly 3,000 students across four schools—Carver, Huntington, Valentine elementaries, Huntington Middle School, and San Marino High School—and it consistently ranks among the top 1 to 3 percent of California public schools. San Marino High School's UC-eligibility rate and average SAT scores place it in a tier that most SGV families would pay significantly extra to access.
The school premium in San Marino is structural, not speculative. It is not driven by a hot market or short-term demand—it has persisted through multiple interest rate cycles and two recessions. Families who can afford a $3M home in San Marino versus a $1.8M home in neighboring Alhambra are often making that $1.2M premium decision explicitly because of SMUSD. This demand is geographically locked: buyers cannot get SMUSD enrollment from a Pasadena or Arcadia address.
When San Marino Homes Sell Fastest: Spring vs. Summer vs. Fall
San Marino does not follow a textbook seasonal pattern. The city's heavy international buyer concentration and SMUSD school-enrollment calendar create two distinct demand surges that differ from the broader LA metro pattern. Understanding these surges is one of the clearest advantages a seller can have when choosing a list date.
The primary peak runs from February through May. International buyers who spent winter researching properties arrive in late February and March. Simultaneously, SGV families who want SMUSD enrollment for the following fall need to close by mid-spring to meet enrollment windows. This combination creates the year's highest offer volumes and strongest list-to-sale ratios. Listings that launch in the first week of March consistently outperform listings that launch in mid-April—by the time April arrives, the most motivated buyers have already transacted.
Is San Marino a Seller's Market or Buyer's Market in 2026?
The honest answer is tier-dependent. Below $3.5 million, San Marino is clearly a seller's market in mid-2026, with sub-30-day absorption on well-priced homes and overbid ratios remaining above 100 percent. Above $4 million, the market becomes balanced and in some cases buyer-favorable, with longer marketing periods and more price negotiation.
The overall city is best described as seller-leaning. Inventory has not expanded meaningfully even as prices have risen, because the combination of Prop 13 lock-in for longtime owners and the city's physical supply cap keeps resale inventory artificially constrained. Many San Marino owners have held their homes for 20 to 40 years—at Prop 13 tax bases far below today's values—and have little financial incentive to sell unless a life event forces the transaction.
- ✓ Inventory chronically thin (20–35 active homes)
- ✓ Multiple-offer situations persist sub-$3.5M
- ✓ All-cash buyer pool reduces financing contingency risk
- ✓ SMUSD demand is non-cyclical and geographically locked
- ✓ International buyer pool adds a second demand layer
- ✓ No Measure ULA transfer tax (San Marino is not in LA city)
- ✓ 104% list-to-sale ratio citywide
- ✗ Estate tier ($4M+) requires 45–90+ day patience
- ✗ Price sensitivity to condition—deferred maintenance shows at this tier
- ✗ International buyer pauses around Lunar New Year
- ✗ Estate-tier comps are thin, creating appraisal risk if financed
- ✗ Overpricing stigma is fast and difficult to reverse in a small market
- ✗ Fire insurance costs rising across SGV, affecting buyer carry costs
San Marino vs. Pasadena, Arcadia, and San Gabriel: Where Does Your Money Go?
One of the most common conversations I have with clients considering San Marino is how it compares to neighboring cities at similar price points. The answer depends on what you value, and the comparison table below makes the trade-offs explicit.
| Factor | San Marino | Pasadena | Arcadia | San Gabriel |
|---|---|---|---|---|
| Median Sale Price | ~$3.2M | ~$1.55M | ~$1.1M | ~$820K |
| Price Per Sq Ft | ~$1,100 | ~$700 | ~$620 | ~$540 |
| Avg Days on Market | ~35 | ~28 | ~24 | ~20 |
| School District Rating | SMUSD (Top 1–3%) | PUSD (Mixed) | AUSD (Top 5–8%) | SGUSD (Average) |
| All-Cash Rate | ~45% | ~25% | ~35% | ~28% |
| Measure ULA Transfer Tax | No (not LA city) | No (not LA city) | No (not LA city) | No (not LA city) |
| Commercial Zoning | Minimal/none | Significant | Moderate | Significant |
| Lot Sizes (typical SFR) | 10,000–20,000 sf | 6,000–12,000 sf | 7,000–15,000 sf | 5,500–9,000 sf |
| International Buyer Presence | Very High | Moderate | High | Moderate-High |
| 5-Year Appreciation (est.) | +38–45% | +28–34% | +30–36% | +22–28% |
The premium you pay for San Marino over Arcadia is roughly $2.1 million at the median. That premium buys a top-1% school district versus top-5-8%, larger lots, a no-commercial character that is nearly impossible to find in the SGV, and a buyer pool that will pay that same premium when you eventually sell. It is a self-reinforcing dynamic that has held across multiple market cycles.
San Marino Appreciation History and Long-Term Investment Case
San Marino has outperformed the broader LA County luxury median in every 5-year rolling period since 2000, with the exception of the 2007 to 2012 correction window—and even then, San Marino recovered faster than most SGV cities. The city's structural scarcity (no new construction, fixed parcel count) combined with non-cyclical school demand creates a floor that cities with expandable housing supply simply cannot match.
The rent-versus-own calculus in San Marino is straightforward but often misunderstood by buyers who focus only on the monthly cost comparison. At $3.2M with a 30 percent down payment and a 7 percent jumbo rate, the monthly carry is significant—roughly $15,000 to $17,000 per month all-in including taxes and insurance. A comparable rental in San Marino would cost $10,000 to $12,000 per month for a similarly sized home. On a pure monthly basis, renting appears cheaper. But San Marino ownership has historically delivered $150,000 to $300,000 per year in appreciation—which converts the apparent monthly loss into a compounding equity gain.
From approximately $1.9M median in 2016 to $3.2M in 2026. Compound annual growth rate of roughly 5.3 percent, outperforming most CA cities at this price tier.
Driven by post-COVID luxury migration from LA and Bay Area, plus continued SGV diaspora demand. The 2022 rate shock caused a 12-month pause; recovery was faster than expected.
Gross rental yield on a $3M San Marino home is low relative to the purchase price. San Marino is an appreciation play, not a cash flow play. Investors targeting income should look at Alhambra or Monterey Park instead.
San Marino's effective property tax rate for long-held properties is often well below 1 percent of current market value due to Prop 13 caps. A home purchased in 1990 for $800K may have a tax base equivalent to $1.1M, even though the home is worth $3.5M today.
What Will You Net? San Marino Sale Proceeds Estimate at Three Price Bands
These are ballpark figures based on typical San Marino closing costs. Actual net proceeds depend on your mortgage payoff, negotiated commission, specific transfer tax, and any seller-paid concessions. Use this as a starting framework, not a guarantee.
| Sale Price | Commission (2.5%) | Transfer Tax | Escrow & Title | Staging & Prep | Est. Net (no mortgage) |
|---|---|---|---|---|---|
| $2,500,000 | $62,500 | $2,750 | ~$8,000 | ~$12,000 | ~$2,414,750 |
| $3,200,000 | $80,000 | $3,520 | ~$10,000 | ~$15,000 | ~$3,091,480 |
| $5,000,000 | $125,000 | $5,500 | ~$14,000 | ~$25,000 | ~$4,830,500 |
Transfer tax: San Marino is not in the City of Los Angeles. County transfer tax applies at $1.10 per $1,000 of sale price. No Measure ULA excise tax. No city transfer tax. Estimates do not include capital gains taxes—consult a CPA for tax planning before listing.
What San Marino Sellers Should Do Before Going on the Market
In a market where first impressions carry outsized weight—and where buyers are sophisticated enough to recognize deferred maintenance at a glance—pre-listing preparation is not optional, it is a return-on-investment decision. The buyers who can afford a $3M San Marino home have almost certainly also looked at homes in Pasadena, Arcadia, and South Pasadena. They compare condition, not just price. A home that presents perfectly will draw more competitive offers and shorter timelines than a home at the same price that shows tired.
What follows is a practical checklist I use with San Marino sellers before any listing goes live. Not every item applies to every property, but the logic behind each one reflects real-world feedback from the buyers who have toured San Marino homes over the past 13 years.
| Category | Action Item | Typical Cost | Impact |
|---|---|---|---|
| Curb Appeal | Refresh landscaping, repaint front door, clean driveway | $2,000–$6,000 | High — first-in-person impression |
| Interior Paint | Neutral repaint of high-traffic rooms; touch-up throughout | $4,000–$12,000 | High — removes buyer's first credit request |
| Kitchen Update | Hardware refresh, appliance deep-clean or replacement | $1,500–$8,000 | High — kitchen sells homes at this price tier |
| Flooring | Refinish hardwood if dull; replace dated carpet in bedrooms | $3,000–$10,000 | Medium-High |
| Pre-Sale Inspection | Order a full home inspection before listing; disclose and address findings | $600–$900 | Very High — prevents surprise credits in escrow |
| Professional Staging | Full furniture staging for key living areas, primary suite, and kitchen | $4,000–$15,000 | High — online photos drive showing requests |
| Photography | Professional architectural photography + drone exterior | $800–$2,500 | Critical — 90%+ of buyers first see your home online |
| SMUSD Verification | Pull official enrollment map; attach to listing documents | Free | Very High for buyers with school-age children |
| CLUE Report | Pull 5-year insurance claims history; share proactively in disclosures | Free from insurer | Medium — removes a common buyer due-diligence question |
| Permit Verification | Pull city permit history; flag any unpermitted additions for disclosure | Free from city | High — unpermitted work discovered in escrow kills deals |
The permit verification item deserves special attention. San Marino's older housing stock—many homes date from the 1920s through 1950s—often includes room additions, garage conversions, or pool structures added without permits across prior ownerships. When a buyer's inspector flags an unpermitted structure, the buyer gains an automatic credit negotiation point. Disclosing proactively and either legalizing the work or adjusting the price upfront is almost always cheaper than defending the point in escrow under time pressure.
San Marino Seller Strategy Cheat Sheet
Every San Marino seller situation is different. This matrix maps your circumstances to the recommended positioning approach. If your situation does not fit neatly into one row, call me—the complexity is usually in the details.
| Move-in ready, priced under $3.5M, listing in March–April | Price at market, offer date in 7 to 10 days, expect multiple offers and overbid. |
| Estate tier ($4M+), needs cosmetic work | Invest $50K–$100K in pre-sale updates. A renovated $4M home sells faster than a tired $3.75M home. Price the renovation back into the ask. |
| Listing in January (Lunar New Year window) | Delay to February 15 or later. The international buyer pool is in travel mode; launching during this window leaves your first 3 weeks of showing activity depressed. |
| Long-held property with Prop 13 base, considering Prop 19 | Consult a CPA before listing. Prop 19 allows senior homeowners to transfer their tax base to a replacement home statewide. This can save $30K–$80K per year in property taxes on the new home. |
| SMUSD boundary adjacent to Pasadena | Pull the official district enrollment map and attach it to the listing. Buyer agents will ask. Having it ready signals preparedness and removes a negotiation pressure point. |
| Seller in a probate or trust situation | Get the probate court or trustee approval timeline clarified before listing. San Marino buyers with international profiles often have firm travel windows—a delayed close due to trust complications can kill a deal. |
| Wanting maximum price but flexible on timeline | List in early March, do not rush to the first offer. In a tight inventory environment, waiting two to three weeks for competing offers is often worth $50K–$150K at this price tier. |
| Fire insurance cost concern from buyer | San Marino has fewer wildfire exposure concerns than foothill cities. Pull a CLUE (loss history) report proactively and have your current insurer provide a transferability letter. This removes a common buyer objection at no cost. |
San Marino Real Estate Market: 8 Questions Buyers and Sellers Ask
What is the median home price in San Marino CA in 2026?
The median sale price in San Marino is approximately $3.2 million in 2026, with price per square foot averaging around $1,100. Luxury estate properties above 5,000 square feet routinely trade above $5 million.
How long does it take to sell a home in San Marino?
Well-priced San Marino homes typically sell in 30 to 45 days. Overpriced listings or properties needing significant work can sit 90 days or longer. Spring (March through May) consistently produces the fastest absorption. Estate-tier homes ($4M+) should budget 60 to 90 days minimum.
Is San Marino a buyer's or seller's market in 2026?
San Marino sits in a balanced-to-seller-leaning market in 2026. Inventory is thin with typically 20 to 35 active listings at any time. Multiple-offer situations still occur on move-in-ready homes priced under $3.5 million. Above $4 million, buyers have stronger negotiating position and longer decision timelines.
What percentage of San Marino home sales are all-cash?
Approximately 40 to 50 percent of San Marino transactions close all-cash, driven largely by international buyers and local SGV move-up purchasers. This rate is among the highest of any San Gabriel Valley city and reduces the interest rate sensitivity that affects more financed markets.
How do San Marino home prices compare to Pasadena and Arcadia?
San Marino's median of $3.2 million is roughly double Pasadena's $1.55 million and triple Arcadia's $1.1 million. The SMUSD school district, estate lot sizes, and no-commercial-zoning character command a consistent premium over neighboring cities that has persisted across multiple market cycles.
Does the SMUSD school district affect San Marino home values?
Yes, SMUSD is a primary demand driver. San Marino High School consistently ranks among California's top 1 percent. Buyers specifically relocate to San Marino for district access, and homes within clear SMUSD boundaries sell faster and at higher prices than comparable homes just outside the border.
What is the best time of year to sell a home in San Marino?
March through May is the peak window, driven by school-enrollment deadlines and international buyer activity before summer travel. September and October produce a secondary surge. December and January are the slowest months, particularly around the Lunar New Year calendar, when international buyer travel pauses.
Are there rent control laws that affect San Marino investment properties?
San Marino is not subject to the City of Los Angeles rent stabilization ordinance. California's AB 1482 statewide rent control law applies to eligible multi-unit properties (built before 2007), capping annual increases at 5 percent plus CPI. Single-family homes and condos are generally exempt from AB 1482.
Related San Marino and SGV Resources
About Justin Borges
💰 What's My Home Worth in 2026?
Get a free, accurate valuation from Justin Borges — backed by real comps, not a Zestimate.
Get My Free Home Valuation →Ready to Make a Move in San Marino?
Whether you are pricing a home to sell or searching for your next luxury property, the San Marino market rewards preparation and precision. Let's talk through your situation.