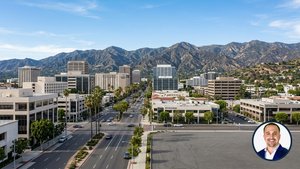




Selling a Home in North Hollywood in 2026
Real sub-area pricing, honest market data, and what you actually net from NoHo Arts to the industrial border.
🏠 FREE Weekly Workshop — First-Time Buyer Blueprint
Learn exactly how to buy a home in LA — prices, process, and pitfalls. Live every week, totally free.
Reserve Your Free Seat →Selling a home in North Hollywood in 2026 means knowing which pocket you are in. The median sale price sits around $860,000 to $890,000 for the zip codes combined, but NoHo Arts District single-family residences routinely trade at $900,000 to $1.3M while industrial-border properties can sit in the high $600,000s. Inventory is thin, buyers are choosy, and a move-in-ready home with an ADU is the strongest play in the current market.
In my 13 years working the Valley, I have watched North Hollywood go through a transformation that most sellers still have not fully priced into their expectations. The area's identity is split. Lankershim Boulevard and the NoHo Arts District carry a cultural cachet that draws buyers from Silver Lake and Los Feliz who got priced out. Tujunga Village is a walkable pocket with its own quiet charm. And then there are sections along the industrial corridor toward Van Nuys where the neighborhood tells a different story.
What I tell my NoHo sellers is this: your zip code matters, but your block matters more. Two homes on different streets within 91601 can have a $200,000 spread in market value. Before you price anything, you need to understand which tier you are actually selling in.
The 2026 market adds another layer of nuance. District NoHo, a 15.7-acre transit-oriented development at Lankershim and Chandler, is underway at the Metro station. That project, once delivered, will add 1,481 residential units, 450,000 square feet of office, and 60,000 square feet of retail. Buyer confidence near the Metro corridor is real. Meanwhile, homes requiring significant work are sitting longer Valley-wide, and that pattern is particularly visible in North Hollywood.
What Is in This Guide
- North Hollywood Market Snapshot 2026
- NoHo by Sub-Area — Where You Live Determines What You Net
- Median Prices by ZIP Code
- Pricing Strategy for North Hollywood
- Pre-Listing Prep That Actually Moves the Needle
- North Hollywood vs. Van Nuys vs. Burbank — Seller Comparison
- Schools and What Buyers Are Really Asking
- Crime Data by Sub-Area — Honest Conversation
- ADUs and What They Are Worth to Sellers
- Working With a North Hollywood Listing Agent
- Frequently Asked Questions
- Quick Reference Cheat Sheet
North Hollywood Market Snapshot 2026
The data going into spring 2026 tells a story of modest softening off the 2021 to 2023 peak, but far from a crash. February 2026 showed North Hollywood's median sale price at approximately $860,000, down 4.3% year over year. April 2026 median list prices were around $849,000. Both figures represent a real correction from the frenzy years, but inventory remains thin enough to keep the market competitive for well-prepared sellers.
The spread across North Hollywood is wide. Zillow data breaks it down by ZIP: 91602 leads at approximately $1.04M median, followed by 91601 at $927,000, then 91606 at $840,000 and 91605 at $795,000. Within any of those ZIPs, sub-area and condition can push you significantly above or below those benchmarks.
"North Hollywood is three different markets wearing the same neighborhood name. When I do a CMA here, the first question I ask is not what's your zip code -- it's which side of Vineland are you on." Justin Borges, DRE #01940318, The Borges Real Estate Team
Market velocity has slowed slightly. Average days on market climbed from 59 days in the prior year to approximately 64 days in early 2026. That slower pace is not uniform. NoHo Arts homes in good condition are still seeing multiple offers within the first two weeks. Properties that need work or are located near industrial stretches are lingering well past 90 days.
Inventory remains below historical norms. The lock-in effect is real: sellers who bought in 2018 to 2022 at sub-4% rates are reluctant to trade into the 6.5% to 7.5% rate environment. That seller reluctance keeps supply constrained, which is good news for anyone who does decide to list in 2026.
Key Insight: North Hollywood's thin inventory means a well-priced, well-prepped listing still generates real competition. The market is not a buyer's market by any traditional definition -- it just rewards preparation more than it used to.
NoHo by Sub-Area — Where You Live Determines What You Net
This is the section most generic seller guides skip. They give you one number for the whole zip code and call it a day. That number is useless if you do not know which pocket of North Hollywood you are in.
I break North Hollywood into four seller tiers that actually reflect how buyers shop and how appraisers comp:
Sub-Area Price Comparison
Median Prices by ZIP Code — North Hollywood 2026
Here is how the four primary North Hollywood ZIP codes stack up based on current and recent sales data:
A few things to note. ZIP 91602 skews higher because it captures Tujunga Village and parts of the Lankershim arts corridor where larger lots and renovated homes push the median up. ZIP 91605 is the most affordable because it contains more of the industrial-transition area near the western edge.
Price per square foot across North Hollywood in 2026 runs approximately $490 to $530, down roughly 10% from the 2022 to 2023 peak but still significantly above the 2019 to 2020 pre-pandemic range of $420 to $460.
Pricing Strategy for North Hollywood
The pricing conversation in North Hollywood is where most sellers either leave money on the table or overprice and start a downward spiral. Let me walk through how I think about it by sub-area.
NoHo Arts District — Price at Market, Not Above
The temptation in the Arts District is to list high because you know the brand carries a premium. Resist it. Buyers who shop NoHo Arts are sophisticated. They are cross-shopping with Silver Lake and Atwater Village. An overpriced NoHo Arts home sits, and the DOM clock starts working against you. Price within 2% to 4% of fair market value and let the multiple offers do the work.
Tujunga Village — Do Not Underestimate Your Street
What I tell my Tujunga Village sellers is that you are often worth more than you think. The village walkability, the tree canopy, the community feel, these are real amenities that buyers pay for. I have seen agents pull comps from two blocks outside the village and underprice a home by $50,000 to $80,000. Insist on hyper-local comps.
Core North Hollywood — Value Messaging Wins
For core NoHo listings along Victory Boulevard and Magnolia, the pitch to buyers is value relative to Burbank with the same Metro access. Price your home to attract first-time buyers and investors, and lead with the income story if you have an ADU or garage conversion.
Industrial Border — Price for the Buyer Pool You Have
In the industrial corridor zones, you are fishing in a smaller pond. Investors, contractors, and buyers who prioritize square footage over neighborhood aesthetics. Price to attract that pool specifically, not to compete with NoHo Arts homes. Overpricing here leads to prolonged market time and eventual reductions that hurt your net.
"I have done deals in North Hollywood where two listings on the same ZIP code had a $250,000 difference in sale price. The street matters. The school catchment matters. The freeway proximity matters. A zip code average tells you almost nothing." Justin Borges, DRE #01940318
Pricing by Condition — 2026 Buyer Expectations
| Condition | Expected Position | DOM Expectation | Financing Risk |
|---|---|---|---|
| Move-in Ready + Staged | At or above market, multiple offers possible | 14–30 days | Low — all loan types qualify |
| Cosmetically Dated, Solid Systems | 3–7% below top-of-market | 30–60 days | Low to moderate |
| Deferred Maintenance | 8–15% below comparable updated homes | 60–120 days | Moderate — FHA/VA may flag issues |
| Investor/AS-IS | 15–25% below market, cash pool | Variable | High — typically cash-only buyer |
Pre-Listing Prep That Actually Moves the Needle
North Hollywood buyers are practical. They are not looking for a flip. They are looking for a home that does not require immediate emergency spending. That means your pre-listing budget should target what buyers notice on day one, not what an HGTV producer would suggest.
Pre-Listing ROI Table
| Improvement | Typical Cost | Value Add | ROI Multiple |
|---|---|---|---|
| Professional Staging | $2,000–$5,000 | $15,000–$40,000 | 5–10x |
| Professional Photography | $400–$800 | Faster sale, higher offers | Hard to quantify, always positive |
| Interior Paint (Neutral) | $2,500–$6,000 | $8,000–$20,000 | 3–5x |
| Landscaping / Curb Appeal | $500–$2,000 | $5,000–$15,000 | 3–5x |
| Carpet Replacement | $1,500–$4,000 | $5,000–$12,000 | 2–4x |
| HVAC Service + Cert | $200–$400 | Kills buyer negotiation point | High defensive value |
| ADU Permitting | $5,000–$15,000 | $60,000–$120,000 | 6–12x |
| Full Kitchen Remodel | $35,000–$60,000 | $15,000–$30,000 | 0.5–0.8x — rarely pencils out |
Note: ROI estimates are ranges based on current North Hollywood market conditions and are not guarantees. Actual results vary by sub-area, condition, and buyer pool.
The one thing that catches sellers off guard in North Hollywood is unpermitted work. The ADU that grandpa built in the backyard. The garage conversion that never got signed off. Lenders flag these in appraisals, and if you are trying to sell to a buyer using FHA or VA financing, unpermitted structures can kill the deal. A pre-listing permit pull, while it takes time, is often the single best investment a North Hollywood seller can make.
Justin's rule of thumb: Before you spend $40,000 on a kitchen remodel to sell, call me. In most North Hollywood price tiers, buyers prefer to choose their own finishes. You are more likely to net more by spending $5,000 on staging and a fresh paint job than $40,000 on a kitchen nobody asked for.
The North Hollywood Pre-Listing Timeline
8 Weeks Before Listing
CMA consultation, sub-area positioning, identify permit issues, initiate any repairs, schedule staging consultation.
5 Weeks Before Listing
Complete repairs, start paint work, address deferred maintenance, initiate any permit filings if needed.
2 Weeks Before Listing
Deep clean, staging delivery and set-up, professional photography and Matterport 3D tour, review disclosures.
Launch Day
MLS live with embargoed period, syndication across all portals, agent preview, open house weekend scheduled.
North Hollywood vs. Van Nuys vs. Burbank — Seller Comparison
If you are deciding whether to sell now or wait, one useful lens is how your market compares to adjacent neighborhoods. Here is an honest side-by-side:
| Factor | North Hollywood | Van Nuys | Burbank |
|---|---|---|---|
| Median Sale Price | $860K–$890K | $778K–$809K | $1.17M–$1.27M |
| YoY Price Change | -4.3% | -7.7% | -2% (more stable) |
| Avg Days on Market | 64 days | 70–80 days | 45–55 days |
| School Quality | LAUSD, mixed (7/10 high school) | LAUSD, lower avg | Burbank USD, highly rated |
| Crime Relative Rating | 23rd percentile safety | Lower percentile | Significantly safer |
| Metro Access | Excellent (B Line hub) | Good (Orange Line) | Limited Metro access |
| Entertainment Industry | Adjacent (NoHo Arts) | Minimal | Warner Bros., Disney — major employer |
| Buyer Profile | Creative class, first-time buyers, investors | Investors, entry-level buyers | Families, entertainment workers |
The Burbank premium is real and well-earned. Better schools, lower crime, and major studio employment drive values 30% to 40% above North Hollywood. That is not changing in 2026.
Van Nuys is softening faster than North Hollywood, down 7.7% year over year versus North Hollywood's 4.3%. The Van Nuys buyer pool is thinner and more price-sensitive. North Hollywood's identity advantage, particularly in the NoHo Arts corridor, gives it a relative demand floor that Van Nuys does not have.
What this means for a North Hollywood seller: if your home is in the arts corridor or Tujunga Village, you are competing favorably against Van Nuys and drawing buyers who have been priced out of Burbank. That positioning matters in how you write your listing and who you market to.
Schools and What Buyers Are Really Asking
Let me be direct about North Hollywood schools, because buyers will ask and you need to know the honest answer.
North Hollywood Senior High School has a 7/10 rating on GreatSchools, with a 9/10 test score rating. Its 2024 graduation rate was 96.4%, and it ranks approximately 169th in California by U.S. News. For a large LAUSD comprehensive high school, those are respectable numbers.
Elementary and middle school options are more variable. North Hollywood is an LAUSD district, which means school quality varies meaningfully by specific school assignment zone. Some buyers in Tujunga Village specifically target that area for its proximity to better-rated elementary programs.
What the School Data Means for Your Sale
School Strengths
- NoHo High is solid (7/10 GreatSchools, 9/10 test scores)
- Tujunga Village access to better elementary programs
- Magnet school options within LAUSD for families
- 96.4% graduation rate at the high school
- Proximity to private schools if families want alternatives
School Challenges
- LAUSD overall perception vs. Burbank USD hurts comparisons
- Elementary school quality varies significantly by zone
- Buyers with school-age children often favor Burbank at a premium
- School assignment boundaries can shift
My advice to sellers: do not hide from the school conversation. Know your exact school catchment, know the ratings, and frame it honestly. If you are in a part of NoHo that feeds into a well-rated school, lead with that. If you are not, focus on the Metro access, the ADU potential, and the price advantage relative to Burbank.
Crime Data by Sub-Area — Honest Conversation
I would rather you hear this from me than read it in a buyer's contingency removal letter. North Hollywood has a crime rate that requires honest positioning, and it varies enormously by sub-area.
The overall North Hollywood crime rate runs approximately 35.86 per 1,000 residents. That places North Hollywood in the 23rd percentile for safety, meaning it is safer than about 23% of comparable cities. That is a real number and buyers will find it.
Crime Varies Dramatically by Area Within NoHo
| Zone | Violent Crime Risk | Property Crime Risk | Relative Safety |
|---|---|---|---|
| North NoHo (Tujunga Village area) | 1 in 249 annually | 1 in 46 annually | Safest sub-area |
| NoHo Arts District core | Moderate | Moderate | Mid-tier within NoHo |
| South NoHo / Industrial Border | 1 in 160 annually | 1 in 36 annually | Highest crime density |
The southeast portion of North Hollywood, roughly the industrial corridor toward Van Nuys, has approximately 1,152 crime incidents per year at a neighborhood level. The contrast with the north section is significant.
How to handle this in your listing conversation: If you are in Tujunga Village or north NoHo, you can legitimately position the crime difference. If you are near the industrial border, the honest play is pricing it into your list price and leading with other strengths: lot size, value, Metro access, and investment potential. Do not try to hide the data -- buyers find it within 10 minutes of searching.
ADUs and What They Are Actually Worth to North Hollywood Sellers
If there is one topic North Hollywood sellers ask me about more than any other in 2026, it is ADUs. The short answer: a permitted, rent-ready ADU is worth more in North Hollywood than almost anywhere else in the Valley, because the income story resonates so strongly with the buyer pool.
A North Hollywood single-family home with a permitted, rent-ready ADU in the $850,000 to $950,000 range is, in many cases, more affordable on a net carrying-cost basis than a comparable home without one at a lower price. When your buyer can offset $1,800 to $2,400 per month of mortgage cost from ADU rent, the effective payment drops significantly. That math motivates buyers.
ADU Value Scenarios in North Hollywood
| ADU Status | Estimated Value Impact | Financing Impact | Recommendation |
|---|---|---|---|
| Permitted, Rent-Ready ADU | +$60,000–$120,000 | All loan types, income counts | Lead with this in all marketing |
| Unpermitted ADU (garage conversion, etc.) | Neutral to negative — can kill FHA/VA deals | Lenders may require removal or permit | Pull permits before listing |
| ADU Potential (large lot, no ADU yet) | +$20,000–$50,000 if marketed correctly | No financing complication | Quantify the ADU potential in listing copy |
| No ADU, no potential | Neutral — priced against comparable inventory | Standard financing | Focus on other strengths |
The unpermitted ADU situation is where I have seen deals go sideways. Sellers who built a garage conversion in 2019 without permits find out at the appraisal stage that their FHA or VA buyer cannot proceed. If you are sitting on an unpermitted structure, the most financially prudent thing you can do before listing is get the permit pulled. The cost is typically $5,000 to $15,000 all in, and the value unlock is $60,000 to $120,000. That math is obvious.
Working With a North Hollywood Listing Agent
What you need from a listing agent in North Hollywood is someone who can disaggregate the market at the block level, not just the zip code level. The difference between a strong listing presentation and a weak one in NoHo is whether your agent can explain why your specific home is positioned where it is, backed by hyper-local comps.
What to Ask Any North Hollywood Listing Agent
| Question | What a Strong Answer Looks Like |
|---|---|
| What sub-area am I in and what does that mean for my price ceiling? | Specific sub-area identification with specific comp data, not a zip code average |
| How do you handle ADU or permit issues? | Clear process for identifying, quantifying, and addressing permit gaps before listing |
| What does your marketing reach look like for North Hollywood specifically? | Cross-market reach into Silver Lake, Atwater Village, and Burbank buyers priced out of their market |
| What is your list-to-sale ratio on your North Hollywood listings? | At or above 97% suggests accurate pricing and effective negotiation |
| How do you handle multiple offer situations? | Clear offer review process, escalation clause management, terms evaluation beyond just price |
Decision Matrix — Should You Sell in 2026?
Scenario A: NoHo Arts or Tujunga Village, Move-In Ready, ADU Permitted
You are holding one of the strongest seller positions in the Valley right now. Thin inventory in this sub-tier means genuine competition for your listing. Buyers priced out of Silver Lake and Los Feliz are your primary pool.
Sell: Strong positionScenario B: Core NoHo, Dated but Solid, Holding at 3.5% Rate
You would get a fair market price today, but you are trading a sub-4% rate for a 6.5% to 7.5% rate on your next purchase. Run the math carefully. If the life change driving the sale is genuine, sell. If it is purely financial, the rate math may favor staying put.
Consider: Run the numbers firstScenario C: Industrial Border, Needs Work, High Deferred Maintenance
This is the toughest sell in the 2026 market. Your buyer pool is mostly investors, and they are pricing in the work aggressively. If you can do targeted pre-listing prep, do it. If the property needs $80,000 or more in work, you might net more selling as-is to an investor at a discount than funding the repairs yourself.
Complex: Get a detailed CMAThe NoHo West Development Factor
One thing I want North Hollywood sellers to understand is the District NoHo project. Trammell Crow Co. and High Street Residential are developing 15.7 acres at Lankershim and Chandler, directly atop the Metro station. That project brings 1,481 residential units, 450,000 square feet of office space, 60,000 square feet of retail, and 2 acres of open space. Transit-oriented developments of this scale have a well-documented track record of lifting residential values in a 0.5 to 1 mile radius. If you are near Lankershim and Chandler, that project is a selling point in your listing narrative.
"If this helped you think through your sale, I would love to earn your trust. Call me, no pressure, no obligation. We will figure out together what the right move is for you." Justin Borges, DRE #01940318, (213) 262-5092
Frequently Asked Questions
💰 What's My Home Worth in 2026?
Get a free, accurate valuation from Justin Borges — backed by real comps, not a Zestimate.
Get My Free Home Valuation →North Hollywood Seller Quick Reference Cheat Sheet
| Data Point | Number / Detail | Source / Notes |
|---|---|---|
| Overall Median Sale Price (2026) | $860,000–$890,000 | Redfin / Movoto Feb–Apr 2026 |
| ZIP 91601 Median | ~$927,000 | Zillow 2025–2026 data |
| ZIP 91602 Median | ~$1,045,000 | Zillow 2025–2026 data |
| ZIP 91605 Median | ~$795,000 | Zillow 2025–2026 data |
| ZIP 91606 Median | ~$840,000 | Zillow 2025–2026 data |
| Average Days on Market | 64 days (up from 59) | Redfin 2026 |
| Year-over-Year Price Change | -4.3% | Feb 2026 vs Feb 2025 |
| NoHo Arts District SFR Range | $900K–$1.3M | Sub-area comp data |
| Tujunga Village SFR Range | $850K–$1.1M | Sub-area comp data |
| Core NoHo SFR Range | $760K–$920K | Sub-area comp data |
| Industrial Border SFR Range | $650K–$800K | Sub-area comp data |
| North Hollywood vs Van Nuys | NoHo +$82K median advantage | Van Nuys median ~$778K |
| North Hollywood vs Burbank | Burbank +$310K–$410K premium | Burbank median $1.17M–$1.27M |
| ADU Premium (Permitted) | +$60,000–$120,000 | Market comp analysis |
| Safety Percentile | 23rd percentile | CrimeGrade.org 2025 |
| North Hollywood High School Rating | 7/10 (GreatSchools), 9/10 test scores | GreatSchools 2025 |
| Justin Borges Direct Line | (213) 262-5092 | DRE #01940318 |
| Office Address | 680 E Colorado Blvd, Suite 180, Pasadena, CA 91101 | The Borges Real Estate Team |
Related Resources
Ready to Talk About Your North Hollywood Sale?
Whether you are in NoHo Arts, Tujunga Village, or the core neighborhood, I will give you a straight-talk CMA and an honest read on what your home is worth right now.
Justin Borges · DRE #01940318 · 680 E Colorado Blvd, Suite 180, Pasadena, CA 91101 · (213) 262-5092 · lametrohomefinder.com
When Is the Best Time to List a North Hollywood Home?
Timing your North Hollywood listing matters, though not as much as preparation and pricing. Here is how seasonality plays out in the NoHo market specifically.
Spring, from late February through May, is the strongest window for seller demand. Families are making school-year decisions, buyers who missed out in winter come back to the market motivated, and the longer daylight hours mean more evening showings. In North Hollywood's NoHo Arts pocket, spring also coincides with the neighborhood's peak activity on Lankershim: outdoor dining, weekend street events, theater openings. Your listing photographs and open houses benefit from ambient energy that does not exist in November.
Summer holds reasonably well in North Hollywood, particularly in the industrial-border and core NoHo tiers where investor buyers are active year-round. Entertainment industry buyers also time purchases to hiatus windows between productions, which often land in summer months.
Fall, from September through November, is historically the second-strongest window. Post-summer urgency pushes buyers who did not transact during spring into action. Inventory typically dips as sellers who did not sell in spring pull listings, which tightens supply and can work in your favor as a new listing.
December and January are the softest months. That said, motivated sellers who list in winter face less competition from other listings. If you cannot wait for spring, a well-priced winter listing in NoHo Arts or Tujunga Village will still find a qualified buyer.
Month-by-Month Seller Advantage Index — North Hollywood
| Month | Buyer Demand | Seller Competition | Net Seller Advantage |
|---|---|---|---|
| January | Low | Low | Neutral — thin market both ways |
| February | Building | Low–Moderate | Moderate — early birds advantage |
| March–April | High | Moderate | Strong — prime seller window |
| May–June | High | High | Moderate — more competition from other sellers |
| July–August | Moderate | Moderate | Neutral to moderate |
| September–October | Moderate–High | Low–Moderate | Good — second-best window |
| November | Declining | Low | Neutral — motivated sellers only |
| December | Low | Very Low | Thin market — serious buyers only |
The North Hollywood Seller Checklist
Use this checklist to track where you stand before going to market. Every item you can check off puts strength in your corner.
| Checklist Item | Status | Why It Matters |
|---|---|---|
| Identify your sub-area tier (NoHo Arts / Tujunga / Core / Industrial) | Essential first step | Determines realistic price ceiling and buyer profile |
| Pull recent comps within 0.5 miles and 6 months | Before any pricing decision | Prevents overpricing or underpricing by thousands |
| Audit for unpermitted ADUs or additions | 8+ weeks before listing | Lender appraisal flags can kill deals if found in escrow |
| Initiate permit process if needed | 6–8 weeks before listing | Permitted ADU adds $60K–$120K in sale price |
| Schedule pre-listing inspection | 6 weeks before listing | Proactive disclosure prevents buyer renegotiation |
| Complete interior paint (neutral tones) | 4–5 weeks before listing | 3–5x ROI, fastest visual impact |
| Landscaping and curb appeal | 3–4 weeks before listing | First impression is formed before buyers reach the front door |
| Schedule professional staging consultation | 3–4 weeks before listing | 5–10x ROI on staging cost vs. sale price |
| Deep clean including HVAC filter, vents, windows | 1 week before listing | Buyers notice smell and cleanliness on day one |
| Professional photography and 3D Matterport tour | 2–3 days before launch | North Hollywood buyers shop online heavily before in-person tours |
| Review all disclosures with your agent | Before MLS launch | California disclosure requirements are strict — surprises cost money |
| Confirm listing strategy: price, launch timing, open house plan | 1 week before listing | Coordinated launch maximizes early momentum |
| Evaluate all offers on total terms, not just price | Offer review phase | Contingency timelines and buyer financing strength matter as much as price |
| Negotiate rent-back if needed for your transition | Offer negotiation | 30–60 day rent-backs are common in NoHo and give you time to buy next |
"The sellers who do the best in North Hollywood are not the ones with the nicest homes. They are the ones who did the pre-work, priced correctly from day one, and knew exactly which buyer they were selling to. That preparation is what I help you build." Justin Borges, DRE #01940318 · (213) 262-5092
District NoHo and What It Means for Sellers Near the Metro
If you own property within a half mile of the North Hollywood Metro station, this section is directly relevant to your sale.
District NoHo, developed by Trammell Crow Co. and High Street Residential, is one of the largest transit-oriented developments in the San Fernando Valley. The project spans 15.7 acres at Lankershim and Chandler, directly atop the existing Metro B Line and G Line station. When complete, it will deliver 1,481 residential units, 450,000 square feet of office space, 60,000 square feet of retail and restaurant space, 3,000 parking stalls, and approximately 2 acres of open public space.
Transit-oriented developments of this density and quality have a documented track record of lifting residential values in the surrounding blocks. The research on comparable projects in Los Angeles, Silver Lake near the Sunset junction, Koreatown near Wilshire Vermont, and Highland Park near the Figueroa Gold Line stations, shows a consistent pattern: values in a 0.5 to 1 mile radius outperform the broader neighborhood by 5% to 15% in the five to seven years following a major anchor development opening.
What this means for sellers near Lankershim, Chandler, Vineland, and Camarillo today is that the patient seller has a tailwind. If you are not under financial pressure to sell immediately, the District NoHo project is a reason to believe that 2027 to 2029 values near the Metro station will exceed 2026 values even in a flat broader market. If you need to sell now, the project is a legitimate forward-looking value argument you can make to buyers who understand urban development cycles.
Metro Proximity Value Premium in North Hollywood
The Metro access story resonates especially well with buyers who work in Downtown LA, Hollywood, Westwood, or the Wilshire Corridor. A buyer who commutes to Downtown can board the B Line at North Hollywood and be at 7th and Metro in under 30 minutes. That is a compelling pitch when Burbank does not offer comparable transit access and has a $300,000 to $400,000 price premium attached.
Gentrification in North Hollywood — What Sellers Need to Know
The word gentrification gets loaded fast. Let me give you the honest seller's-eye view.
North Hollywood has been gentrifying, particularly around the arts district, since the late 1990s when the city of Los Angeles designated the NoHo Arts District to attract theaters and galleries. That 25-year transformation accelerated significantly in the 2015 to 2022 period as buyers priced out of Los Feliz, Silver Lake, and Atwater Village pushed further into the Valley looking for single-family homes under $1M.
For long-term property owners in NoHo, that gentrification wave has been a major wealth-building event. A home purchased in 91601 for $400,000 in 2012 is worth approximately $900,000 to $1.1M today depending on sub-area and condition. That is generational wealth creation driven largely by external demand flow into the neighborhood.
The honest caveat is this: gentrification in North Hollywood is uneven. It runs strongly along the Lankershim corridor and the Tujunga Village pocket. It has reached parts of the core neighborhood but stops short of the industrial edges near the 170 freeway. If you are within the gentrification path, the story you tell buyers is one of momentum and upside. If you are at the edge of it, the story is value and Metro access.
For sellers thinking about timing, the District NoHo development project is the next significant gentrification catalyst in the immediate area. Major mixed-use developments of this scale reliably pull surrounding residential prices upward. Selling in 2026 means selling before that project fully delivers its impact. Sellers who can hold through 2027 to 2029 may find they capture a portion of that upside. Sellers who need liquidity now can still transact at historically strong prices relative to the 2018 to 2019 baseline.
Evaluating Offers in the 2026 North Hollywood Market
In my 13 years in the Valley, the most expensive mistake I see sellers make is evaluating an offer purely on price. The 2026 North Hollywood market has made this lesson even more important.
Buyers in 2026 are more likely to include contingencies than buyers were in 2021 or 2022. That is not a bad thing -- it is a market normalization. But it means a $920,000 offer with a 21-day inspection contingency, a 17-day appraisal contingency, and a buyer using a local lender with a 15-day pre-approval is substantively different from a $930,000 offer with a buyer using an online lender, a 30-day inspection contingency, and no lender contact information in the file.
What I tell my sellers in North Hollywood is to evaluate offers across four dimensions: purchase price, buyer financing quality, contingency terms and timelines, and close-of-escrow flexibility. Sometimes the second-highest offer on price is the best offer overall when you factor in the probability of actually closing.
Offer Evaluation Scoring Matrix
| Factor | Strong Signal | Weak Signal | Weight in Decision |
|---|---|---|---|
| Purchase Price | At or above list, or with clear escalation | More than 5% below list with no justification | High — but not the only factor |
| Down Payment / Loan Type | 20%+ down, conventional or cash | 3.5% FHA on a property with known issues | High — affects appraisal and loan approval risk |
| Lender Quality | Local lender with a verified track record, 15-day pre-approval | Online-only lender, no lender contact info, no pre-approval letter | Moderate to High — I always call the lender |
| Inspection Contingency | 10–14 days, or waived with inspection done pre-offer | 21+ days, open-ended language | Moderate — affects your certainty of close |
| Appraisal Contingency | Waived or with gap coverage clause | Standard contingency with no gap coverage in a priced-above-market scenario | Moderate — matters more above $1M |
| Close-of-Escrow Date | Matches your needs (30 or 45 days), rent-back if needed | Rigid, non-negotiable timeline that conflicts with your move | Moderate — a structural problem can blow up a good deal |
The most important thing you can do when reviewing multiple offers is get your agent on the phone with each buyer's lender before selecting. I have turned down higher offers in North Hollywood based on a two-minute call with a lender who could not answer basic questions about the buyer's file. That call saved my seller from a 45-day escrow that would have fallen through and reset their market clock.